


Data acquisition and flow evalution system
The transsonic windtunnel of DLR in Göttingen is equipped with a modern data acquisition and control system named DeAS [3], [4]. One of the features of this system is an interface to add further measurement devices. While such devices are usually data acquisition hardware or mechanical actuators they may as well be so-called virtual devices. Virtual devices are software running on the data acquisition computer which behave like ordinary devices but make use of the data stream from the data acquisition system in some intelligent manner.
For the F9 experiments a virtual device was implemented which builds up a data communication to a second powerful workstation in the DLR network. The virtual device selects a large subset of the measured data and supplies it to the data evaluation system. The selection of this subset is fast enough in order to not slow down the windtunnel experiment.
The actual flow evaluation and feature recognition process will then be performed in parallel on the second computer. The flow evaluation system was developed according to the special demands of the F9 experiments. The system is highly modular which makes all components easily re-usable for further related application. Many modules were taken from a set of well tested tools developed earlier for flow analysis [5]. Some modules and the graphical user interface were tailored toward the particular requirements of the F9-tests.
Fig. 4 Comparative visualization of pressure distribution
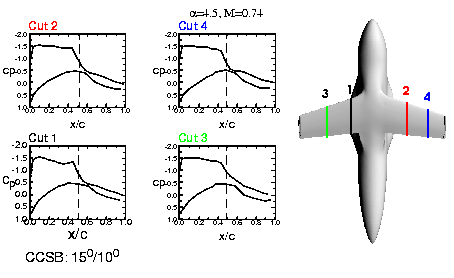
The run-time flow evaluation of the F9-experiments allowed for the interactive evaluation and visualization of pressure distribution in various cross sections, the comparative visualization of such pressure distribution, numerical integration of cross section lift coefficients, determination of shock wave position, and comparative visualization of shock position across wing span. Experience with shock detection and comparative visualization gained in earlier research [6], [7] were taken into account.
All these different post-processing tools may be selected interactively and the results are displayed graphically as shown in Fig. 3. This visualization provides support for the windtunnel crew to select parameters for the following tests. An example of the comparison of pressure profiles is presented in Fig. 4.